Essential Guide to How to Interpret Standard Deviation in 2025
Essential Guide to How to Interpret Standard Deviation in 2025
Understanding standard deviation is crucial for anyone involved in data analysis. It is a key statistical measure that helps in assessing the variability or dispersion of a dataset. In this article, we will explore how to interpret standard deviation effectively, what it signifies in a dataset, and its implications in statistical analyses, including its role in understanding the probability and confidence interval of the data.
Understanding Standard Deviation and Its Significance
Standard deviation quantifies how much data points in a set differ from the mean. A low standard deviation indicates that data points tend to be close to the mean, while a high standard deviation suggests more spread out values. This measure is particularly significant in fields such as finance, psychology, and environmental science where quantifying variability in data is essential for statistical significance.
The Formula for Standard Deviation
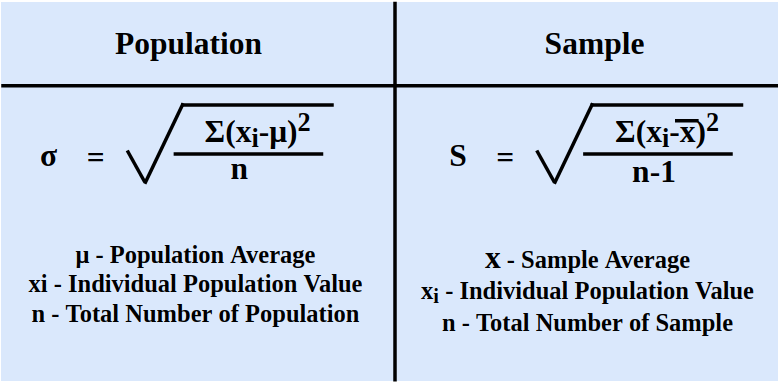
The most common formula for standard deviation (σ) for a population dataset is:
σ = √(Σ(xi – μ)² / N)
Where:
– μ is the mean of the dataset,
– N is the number of observations,
– xi represents each data point.
In this formula, the summation (Σ) computes the total squared deviations from the mean. Understanding this calculation is pivotal in data interpretation as it lays the foundation for further statistical analysis.
Visualization: Understanding Standard Deviation in Graphs
Visual tools, such as graphs, immensely aid in the interpretation of standard deviation. For instance, a normal distribution curve, often referred to as a bell curve, illustrates how data disperses around the mean.
The area under the curve represents the total probability distribution of the dataset. In ideal bell curves, approximately 68% of observations lie within one standard deviation of the mean, while about 95% will fall within two standard deviations. This graphical representation is useful in understanding the dispersion and making informed analyses.

Application of Standard Deviation in Data Analysis
In data analysis, standard deviation serves multiple functions. It is an essential component in various statistical techniques and tests, including hypothesis testing and confidence intervals. By mastering how to interpret and utilize standard deviation, analysts can deliver more accurate insights.
Using Standard Deviation to Identify Outliers
Outliers can skew the results of a study, making the understanding of variability critical. A common method to identify outliers utilizes standard deviation. Typically, any data point that falls beyond two standard deviations from the mean can be considered an outlier.
For example, if a dataset has a mean of 100 with a standard deviation of 10, any number below 80 or above 120 can be flagged as an outlier. This understanding helps maintain the integrity of the dataset, allowing analysts to discern what is truly representative of the population.
The Role of Standard Deviation in Regression Analysis
In regression analysis, standard deviation plays a crucial role in understanding how well the model predicts outcomes. It calculates how much prediction errors deviate from the actual values. A low standard deviation indicates that the model’s predictions are relatively close to the observed results, enhancing the model’s reliability.
Conversely, a high standard deviation suggests that the model may not be effective in making predictions. Therefore, assessing standard deviation in regression provides insights into the statistical relationships within the data and can influence decision-making.
Standard Deviation and its Implications on Statistical Predictions
The implications of standard deviation extend into the realm of predictive modeling and data visualization. By understanding the standard deviation of a dataset, analysts can make predictions with greater accuracy.
Confidence Interval Calculations
Standard deviation is central to calculating confidence intervals, which help assess the reliability of sample estimates. A common approach is to use the formula:
Confidence Interval = Mean ± (Z-score * Standard Deviation / √n)
Where n represents the sample size, and the Z-score corresponds to the desired confidence level (e.g., 1.96 for 95% confidence).
By understanding these calculations, analysts can confidently interpret the data, factoring in the variability and uncertainty inherent in statistical analysis.
Understanding Distribution Types through Standard Deviation
The interpretation of standard deviation also varies with the type of distribution. In the case of a normal distribution, about 68% of data points lie within one standard deviation, while for skewed distributions, this can be quite different. Understanding how your data is distributed can aid in the correct interpretation of its standard deviation.

Key Takeaways
- Standard deviation measures the variability in a dataset, providing context for the mean.
- It is vital for identifying outliers and assessing the reliability of statistical results.
- Standard deviation helps in calculating confidence intervals and predicting outcomes.
- Visualizing data with standard deviation enhances understanding and interpretation.
FAQ
1. What is the difference between standard deviation and variance?
Standard deviation is the square root of variance and provides a measure of dispersion in the same units as the original data, whereas variance expresses dispersion in squared units. This makes standard deviation generally easier to interpret in real-world scenarios, particularly when communicating findings regarding variability in <strong)data interpretation.
2. How does sample size affect standard deviation?
Sample size can influence the stability and reliability of the standard deviation. As sample size increases, the estimate of standard deviation tends to become more reliable and less prone to the influence of outliers. A larger sample generally provides a more accurate representation of the population parameters, improving overall statistical analysis.
3. Can standard deviation be negative?
No, standard deviation cannot be negative. It is derived from the squared differences from the mean, which are always non-negative. Therefore, standard deviation is always zero or positive, indicating either no variability or some level of dispersion in the dataset.
4. How is standard deviation used in hypothesis testing?
In hypothesis testing, standard deviation helps determine the variability of sample means and is crucial in calculating test statistics and p-values. These values help analysts understand whether the observed results are statistically significant or can be attributed to random variance.
5. Why is understanding standard deviation critical in risk assessment?
In risk assessment, understanding standard deviation allows businesses to measure the variability of financial returns or operational processes. A high standard deviation in returns implies greater risk and uncertainty, which is essential for making informed decisions in strategies such as investment or resource allocation.