Effective Ways to Calculate Standard Deviation in Excel: Your 2025 Guide
Effective Ways to Calculate Standard Deviation in Excel
Understanding **standard deviation in Excel** is crucial for anyone dealing with statistics or data analysis. It provides insight into the variance and distribution of data points in a dataset. This guide outlines effective methods to calculate standard deviation, making your statistical tasks simpler and more efficient. Whether you’re a novice or proficient user, learning how to utilize Excel’s functions for calculating standard deviation can greatly enhance your data analysis skills.
Understanding Standard Deviation Concepts in Excel
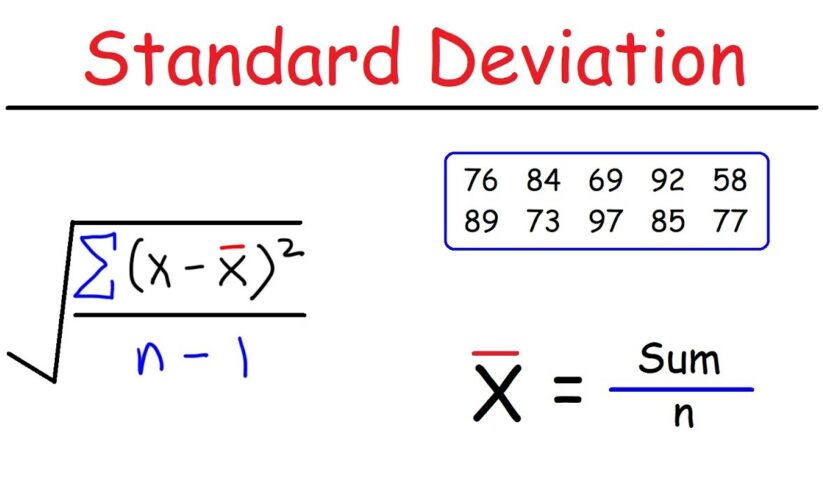
The **standard deviation** is a measurement that indicates the amount of variation or dispersion in a set of values. A low standard deviation means that the data points tend to be close to the mean, while a high standard deviation indicates that the data points are spread out over a larger range of values. **Finding standard deviation in Excel** can be done using various built-in functions. The most commonly used are **STDEV.P** and **STDEV.S**, which are essential for anyone interested in **basic statistics in Excel**.
What is the Excel STDEV Function?
The **Excel STDEV function** helps users calculate standard deviation based on a sample. Specifically, **STDEV.S** computes a standard deviation from a subset of the entire dataset, while **STDEV.P** measures the standard deviation for the entire population. To illustrate, if we have a dataset of test scores for a class, applying **STDEV.S** would analyze variability based only on that class, while **STDEV.P** would use data from all scores possible. This differentiation is crucial when working with **calculation methods for standard deviation in Excel**, allowing for more accurate statistical analysis based on the data context.
Calculating Standard Deviation for a Dataset in Excel
To calculate standard deviation in a dataset using Excel, follow these steps:
- Input or import your dataset into an Excel worksheet.
- Identify the data range you want to analyze.
- In an empty cell, use the formula =STDEV.S(range) for a sample or =STDEV.P(range) for an entire population, replacing range with your data selection.
- Press enter, and Excel will display the standard deviation.
- Interpreting this value allows you to assess the spread of the data regarding the average.
This straightforward approach to **calculating standard deviation for a dataset** highlights how Excel serves as a powerful tool for **statistical analysis in Excel**. Utilize these functions to make sense of variations in data.
Advanced Excel Functions for Statistical Analysis
Diving deeper into **advanced statistics in Excel**, it’s crucial to explore additional statistical measures that complement standard deviation. These functions not only broaden your analytical capabilities but also present clear insights into your datasets.
Exploring Excel Functions for Variation in Data
Excel houses a variety of functions to analyze variability, such as **VAR.P** and **VAR.S**, which calculate variance using similar principles as standard deviation. While standard deviation reflects the average distance of each data point from the mean, variance provides a measure of how far data points are spread out from their average value. Using these alongside standard deviation can amplify your understanding of the data. For example, assessing both **average and standard deviation in Excel** gives you a comprehensive view of data distribution.
Graphical Representation of Standard Deviation in Excel
Visualizing standard deviation can greatly enhance the interpretability of your data analysis. Utilize Excel’s charting capabilities to create interactive charts that include error bars representing standard deviation. To add these in Excel:
- Create a standard graph from your data (e.g., a line or bar chart).
- Click on the chart and select the “Chart Elements” button.
- Check the “Error Bars” option.
- Customize by selecting “More Options” to add standard deviation values as error bars.
Charting **standard deviation in Excel** helps to communicate concepts visually, making it easier to present findings and address patterns, anomalies, and decisions based on statistical data.
Practical Applications of Standard Deviation in Excel
Utilizing **standard deviation in a spreadsheet** has practical implications across various fields, from business analytics to academic research. Identifying trends and deviations is vital in performance metrics and project management, facilitating better decision-making processes.
Using Excel for Statistics in Research and Education
In both research and educational contexts, understanding and applying standard deviation concepts can bolster data literacy. For researchers, using values like **standard deviation** in summary statistics can substantiate findings, while educators can leverage scenarios relating to student scores to illustrate variability in performance. Excel offers an extensive selection of statistical tools to assist with this. Resources such as course materials and workshops can provide hands-on practice for calculating and interpreting statistical measures using Excel, producing a more informed cohort of researchers and students alike.
Real-World Standard Deviation Use Cases in Business Analysis
In the business sector, applying **standard deviation for project management in Excel** can help assess the consistency of project results or evaluate performance metrics. For instance, using standard deviation to track sales performance helps management identify patterns within datasets, minimize risks, and allocate resources wisely. Methods for assessing trends can include using Excel for numerical analysis combined with visualizations such as trend lines in charts, further clarifying the role of consistency in results.
Key Takeaways
- Standard deviation measures data variability and is pivotal in both academic and professional data analysis.
- Excel provides dedicated functions like STDEV.P and STDEV.S for effective handling of population and sample data.
- Integrating graphical representations through charts makes statistical analysis clearer and enhances communication of complex data findings.
- Leveraging standard deviation in real-world scenarios, particularly in business settings, can lead to insights that drive informed decision-making.
- Continued learning through hands-on practice using Excel’s statistical functions will reinforce competence in data interpretation.
FAQ
1. How do I interpret the standard deviation result in Excel?
The standard deviation result indicates how much variation exists from the mean in your dataset. A lower value suggests that the data points are close to the mean, whereas a higher value indicates a wider spread. To fully understand statistical measures, consider how standard deviation fits within broader context when drawing conclusions about **inferring data variability in Excel**.
2. What is the difference between the STDEV.P and STDEV.S functions?
The **STDEV.P** function calculates the standard deviation for an entire population, while the **STDEV.S** function computes it for a sample subset of the data. Depending on the data context — whether dealing with a complete set or a selected group — choose the appropriate function to ensure accuracy in **data analysis in Excel** tasks.
3. Can I visualize standard deviation using charts in Excel?
Yes, you can visualize standard deviation by incorporating error bars into your charts. Excel allows users to display standard deviation visually, highlighting variations within datasets and enhancing the interpretive value of presentations or reports. Utilizing **graphical representations in Excel** effectively communicates statistical findings.
4. What are common errors when calculating standard deviation in Excel?
Common mistakes include incorrectly selecting data ranges or using the wrong standard deviation functions. Employing STDEV.S when dealing with an entire dataset, for instance, can lead to inaccuracies. Double-checking your range and function selection is crucial for producing reliable statistical outputs in Excel.
5. How can statistical functions in Excel benefit my business analysis?
Statistical functions in Excel provide essential insights into performance indicators and help evaluate trends over time. Using tools to calculate standard deviation, variance, and conducting statistical analysis allows businesses to make data-driven decisions, assess their performance consistently, and tailor strategies effectively based on empirical evidence.
6. Is it necessary to have a background in statistics to calculate standard deviation in Excel?
While a statistical background can enhance understanding, it is not mandatory to calculate standard deviation in Excel. Beginners can utilize Excel functions and guided practices to grasp fundamental concepts, becoming more proficient over time as they apply these methods in real-life scenarios.
By incorporating the effective strategies outlined in this guide, you’ll be well on your way to mastering the calculation of **standard deviation in Excel** and improving your overall data analysis capabilities.