Effective Ways to Understand How to Find the Rate of Change in 2025
Understanding the Rate of Change
The rate of change is a fundamental concept in mathematics that describes how a quantity changes relative to another quantity. It’s essential in various fields, including calculus, physics, economics, and everyday applications such as measuring trends. This article aims to provide a comprehensive understanding of how to find the rate of change in different contexts, along with practical examples and applications of this important concept.
Understanding the Definition of Rate of Change
The definition of rate of change refers to how much one quantity increases or decreases relative to another quantity during a specific time interval. Mathematically, it can be described as the change in value divided by the time over which the change occurs. In calculus, this concept is explored through the foundational principles of derivatives and limits. By using the rate of change formula, we can express this relationship quantitatively as:
Rate of change = (Change in value) / (Time interval)
Average Rate of Change vs. Instantaneous Rate of Change
It’s crucial to differentiate between the average rate of change and the instantaneous rate of change. The average rate of change evaluates the change over a specific interval, typically calculated using data points. Conversely, the instantaneous rate of change reflects the value at a particular moment, often determined using derivatives. Understanding these two types can help grasp how quantities behave under different circumstances. For instance, in finding the instantaneous rate of change for a function at a point, we utilize the derivative:
f'(x) = lim(h -> 0) [(f(x + h) – f(x)) / h]
Applications of Rate of Change in Real Life
The concept of rate of change manifests in numerous real-life scenarios. In physics, it represents velocity (change in position over time) and acceleration (change in velocity over time). In economics, it can depict trends in inflation rates, profit margins, and growth rates. Visualizing rate of change in functions helps identify trends and make informed decisions based on how quantities interact. For instance, analyzing online sales growth rates can reveal valuable insights about consumer behavior.
Calculating Rate of Change with Examples
When it comes to calculating rate of change, practical examples can illuminate how this concept applies across various contexts. By exploring sample problems and hypothetical scenarios, learners can become familiar with the techniques, such as utilizing the difference quotient to determine the average rate of change over an interval.
Rate of Change in Calculus: The Derivative
In calculus, the derivative encapsulates the rate of change in calculus. For any function f(x), f'(x) represents the instantaneous rate of change at a specific point. For example, if f(x) = x², then by applying the derivative rules, we find:
f'(x) = 2x. This means that the rate of change of f(x) at any point x is equal to twice the x-value. This principle becomes critical in physics and engineering when defining speed and acceleration, making it easier to solve real-world problems involving motion.
Applications of Rate of Change in Economics
From an economic perspective, understanding the rate of change in economics can assist businesses in making critical decisions. For example, tracking the rate of change in profit over time provides insights into business performance. A practical application could involve examining how a new marketing strategy affects, say, online sales growth data over multiple months. By comparing rates of change over different quarters, businesses can adjust their strategies accordingly.
Graphical Representation of Rate of Change
A graphical representation of rate of change** provides insightful visual cues. Often illustrated using graphs (like slope graphs) and secant lines, we can view changes quantitatively. The slope of a line on a coordinate plane directly correlates with the rate of change – a steeper slope indicates a greater rate of change.
Understanding Slope as Rate of Change
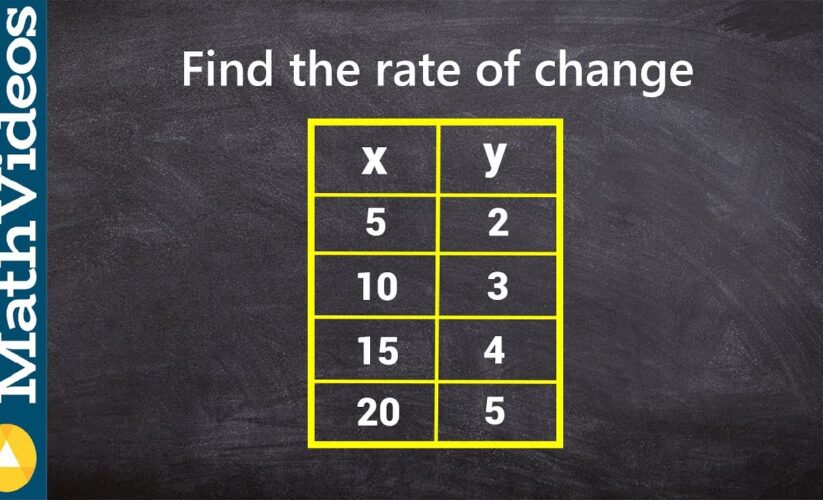
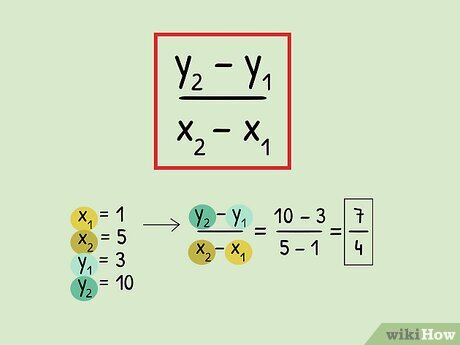
The concept of slope as rate of change is foundational in mathematics. For instance, taking two points (x₁, y₁) and (x₂, y₂) on a graph, the slope (rate of change) can be calculated as:
Slope = (y₂ – y₁) / (x₂ – x₁)
Using this formula allows students and professionals to calculate the average rate over time or distance, assisting in tracking progress and changes across various fields.
Comparing Rates of Change
Often, we need to compare rates of change between different functions or datasets. For instance, how does a company’s performance compare to industry averages? By calculating and visualizing these rates concurrently, businesses can make informed competitive analyses and strategic planning choices. Employing these insights in graphs allows for clear representations of trends and growth patterns.
Key Takeaways on Rate of Change
In summary, understanding rate of change is essential across multiple disciplines. Whether it’s through calculus, economics, or interpreting growth trends, its applications are vast. Key points to remember include:
- The difference between average and instantaneous rates of change.
- Use derivatives to find the instantaneous rate.
- Graphical representations can enhance understanding of rate dynamics.
- Practical applications of rate of change appear in economics and business strategy.
FAQ
1. What is the average rate of change in mathematics?
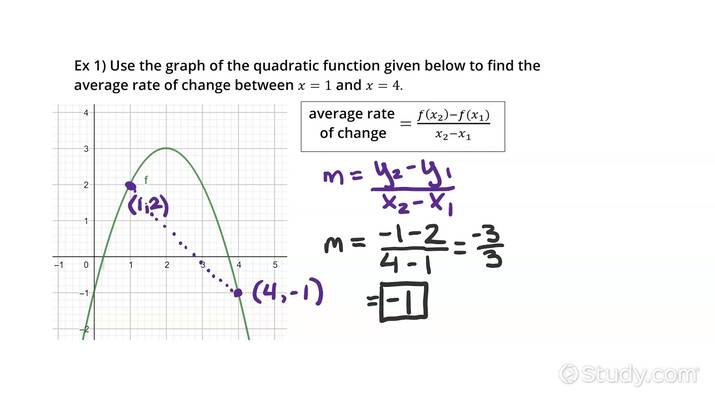
The average rate of change refers to the overall change of a function’s value over a defined interval. It can be calculated by using the formula: (f(b) – f(a)) / (b – a) where [a, b] is the interval on which you’re evaluating the function.
2. How can the rate of change apply to real-life situations?
The rate of change can be observed in various real-life situations, such as tracking population growth over time, monitoring changes in economic indicators like inflation rates, or analyzing speed for journey planning to ensure timely deliveries.
3. What role do derivatives play in calculating the instantaneous rate of change?
Derivatives are fundamental to determining the instantaneous rate of change. Utilizing the limit of the difference quotient, derivatives provide the slope of the tangent at any point on a graph, indicating how a function behaves instantly.
4. How can I visualize rate of change graphically?
Graphically, the rate of change can be visualized using slope. The slope of the secant line between two points on a graph represents the average rate of change, while the tangent line at a single point reflects the instantaneous rate.
5. What is an example of using rate of change in business?
In business, rate of change can track how sales revenue changes over different months or quarters. Analyzing this helps companies determine the effectiveness of their marketing strategies and make adjustments to optimize performance.
6. Can rate of change be negative?
Yes, a negative rate of change indicates a decline in value. For example, if a company’s sales decrease from one quarter to the next, the rate of change would be negative, signifying loss.
7. What is the significance of slope in understanding rate of change?
The slope essentially connects the concept of rate of change to a visual representation. It quantifies how much a function’s output value changes for every unit increase in its input, making it crucial for analysis in mathematics and applied fields.