Effective Ways to Find Standard Deviation on Excel in 2025: Discover Expert Tips
Effective Ways to Find Standard Deviation on Excel in 2025
When it comes to handling data in Excel, understanding how to calculate standard deviation is crucial for many statistical analyses. In this comprehensive guide, we’ll explore effective techniques and tips that not only simplify the excel standard deviation process but also enhance your data analysis skills in Excel. Understanding the significance of the standard deviation formula in Excel will empower you to perform precise data evaluations and statistical assessments.
Understanding Standard Deviation and Its Importance
To find standard deviation in Excel, it’s essential to have a clear grasp of what standard deviation represents. It quantifies the amount of variation or dispersion in a set of data values, helping to understand the spread of data points relative to the mean. This statistical metric is pivotal in many areas, from business analysis to academic research. By learning how to conduct a quick calculation standard deviation, users can help ensure that decisions based on this data are informed and accurate.
Standard Deviation vs Variance
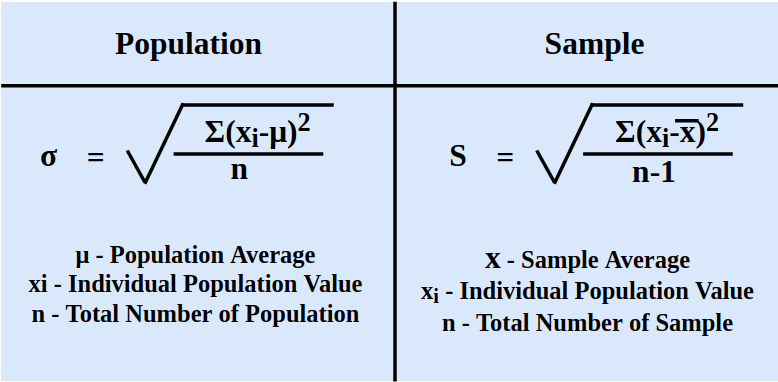
When analyzing your data, it’s common to confuse standard deviation vs variance. While both measure data spread, variance is the average of the squared differences from the mean, whereas standard deviation is simply the square root of variance. In Excel, using formulas like `=VAR.S()` or `=VAR.P()` allows you to calculate variance, and from there, obtaining standard deviation is straightforward. For instance, use `=SQRT(VAR.S(data_range))` to find the standard deviation of a sample group.
Statistical Functions in Excel
Excel offers a suite of statistical functions that makes finding standard deviation intuitive. The most commonly used are `STDEV.S` for a sample standard deviation and `STDEV.P` for a population standard deviation. Using the appropriate function corresponds with your data set’s nature—ensure to understand whether you’re dealing with a population or a sample.
Ordering Data for Accurate Results
Before initiating the standard deviation calculation, it’s beneficial to organize your data properly. Ensuring there are no errors or data handling in Excel missteps will lead to more reliable results. Utilize sorting features or conditional formatting in Excel to identify and eliminate outliers that could skew your standard deviation results. Accurately preparing your data set is half the battle!
Using the STDEV Function in Excel
Now let’s delve into the nitty-gritty of how to use STDEV in Excel. Using the `STDEV.S` or `STDEV.P` function is straightforward: click on the cell where you’d like your result, type the function, and select the range of your data. A typical formula might look like this: `=STDEV.S(A2:A10)`. This tip is particularly useful for excel for statistics courses or self-study.
Practical Example of Using STDEV
For instance, if you have a list of student test scores in cells A1 through A10 and want to determine the standard deviation in Excel, you would input `=STDEV.S(A1:A10)`. This provides you with the sample standard deviation which informs you about the reliability and consistency of the test scores. Ensuring to use `STDEV.P` if the scores represent the entire population adds accuracy to your findings.
Interpreting Standard Deviation Results
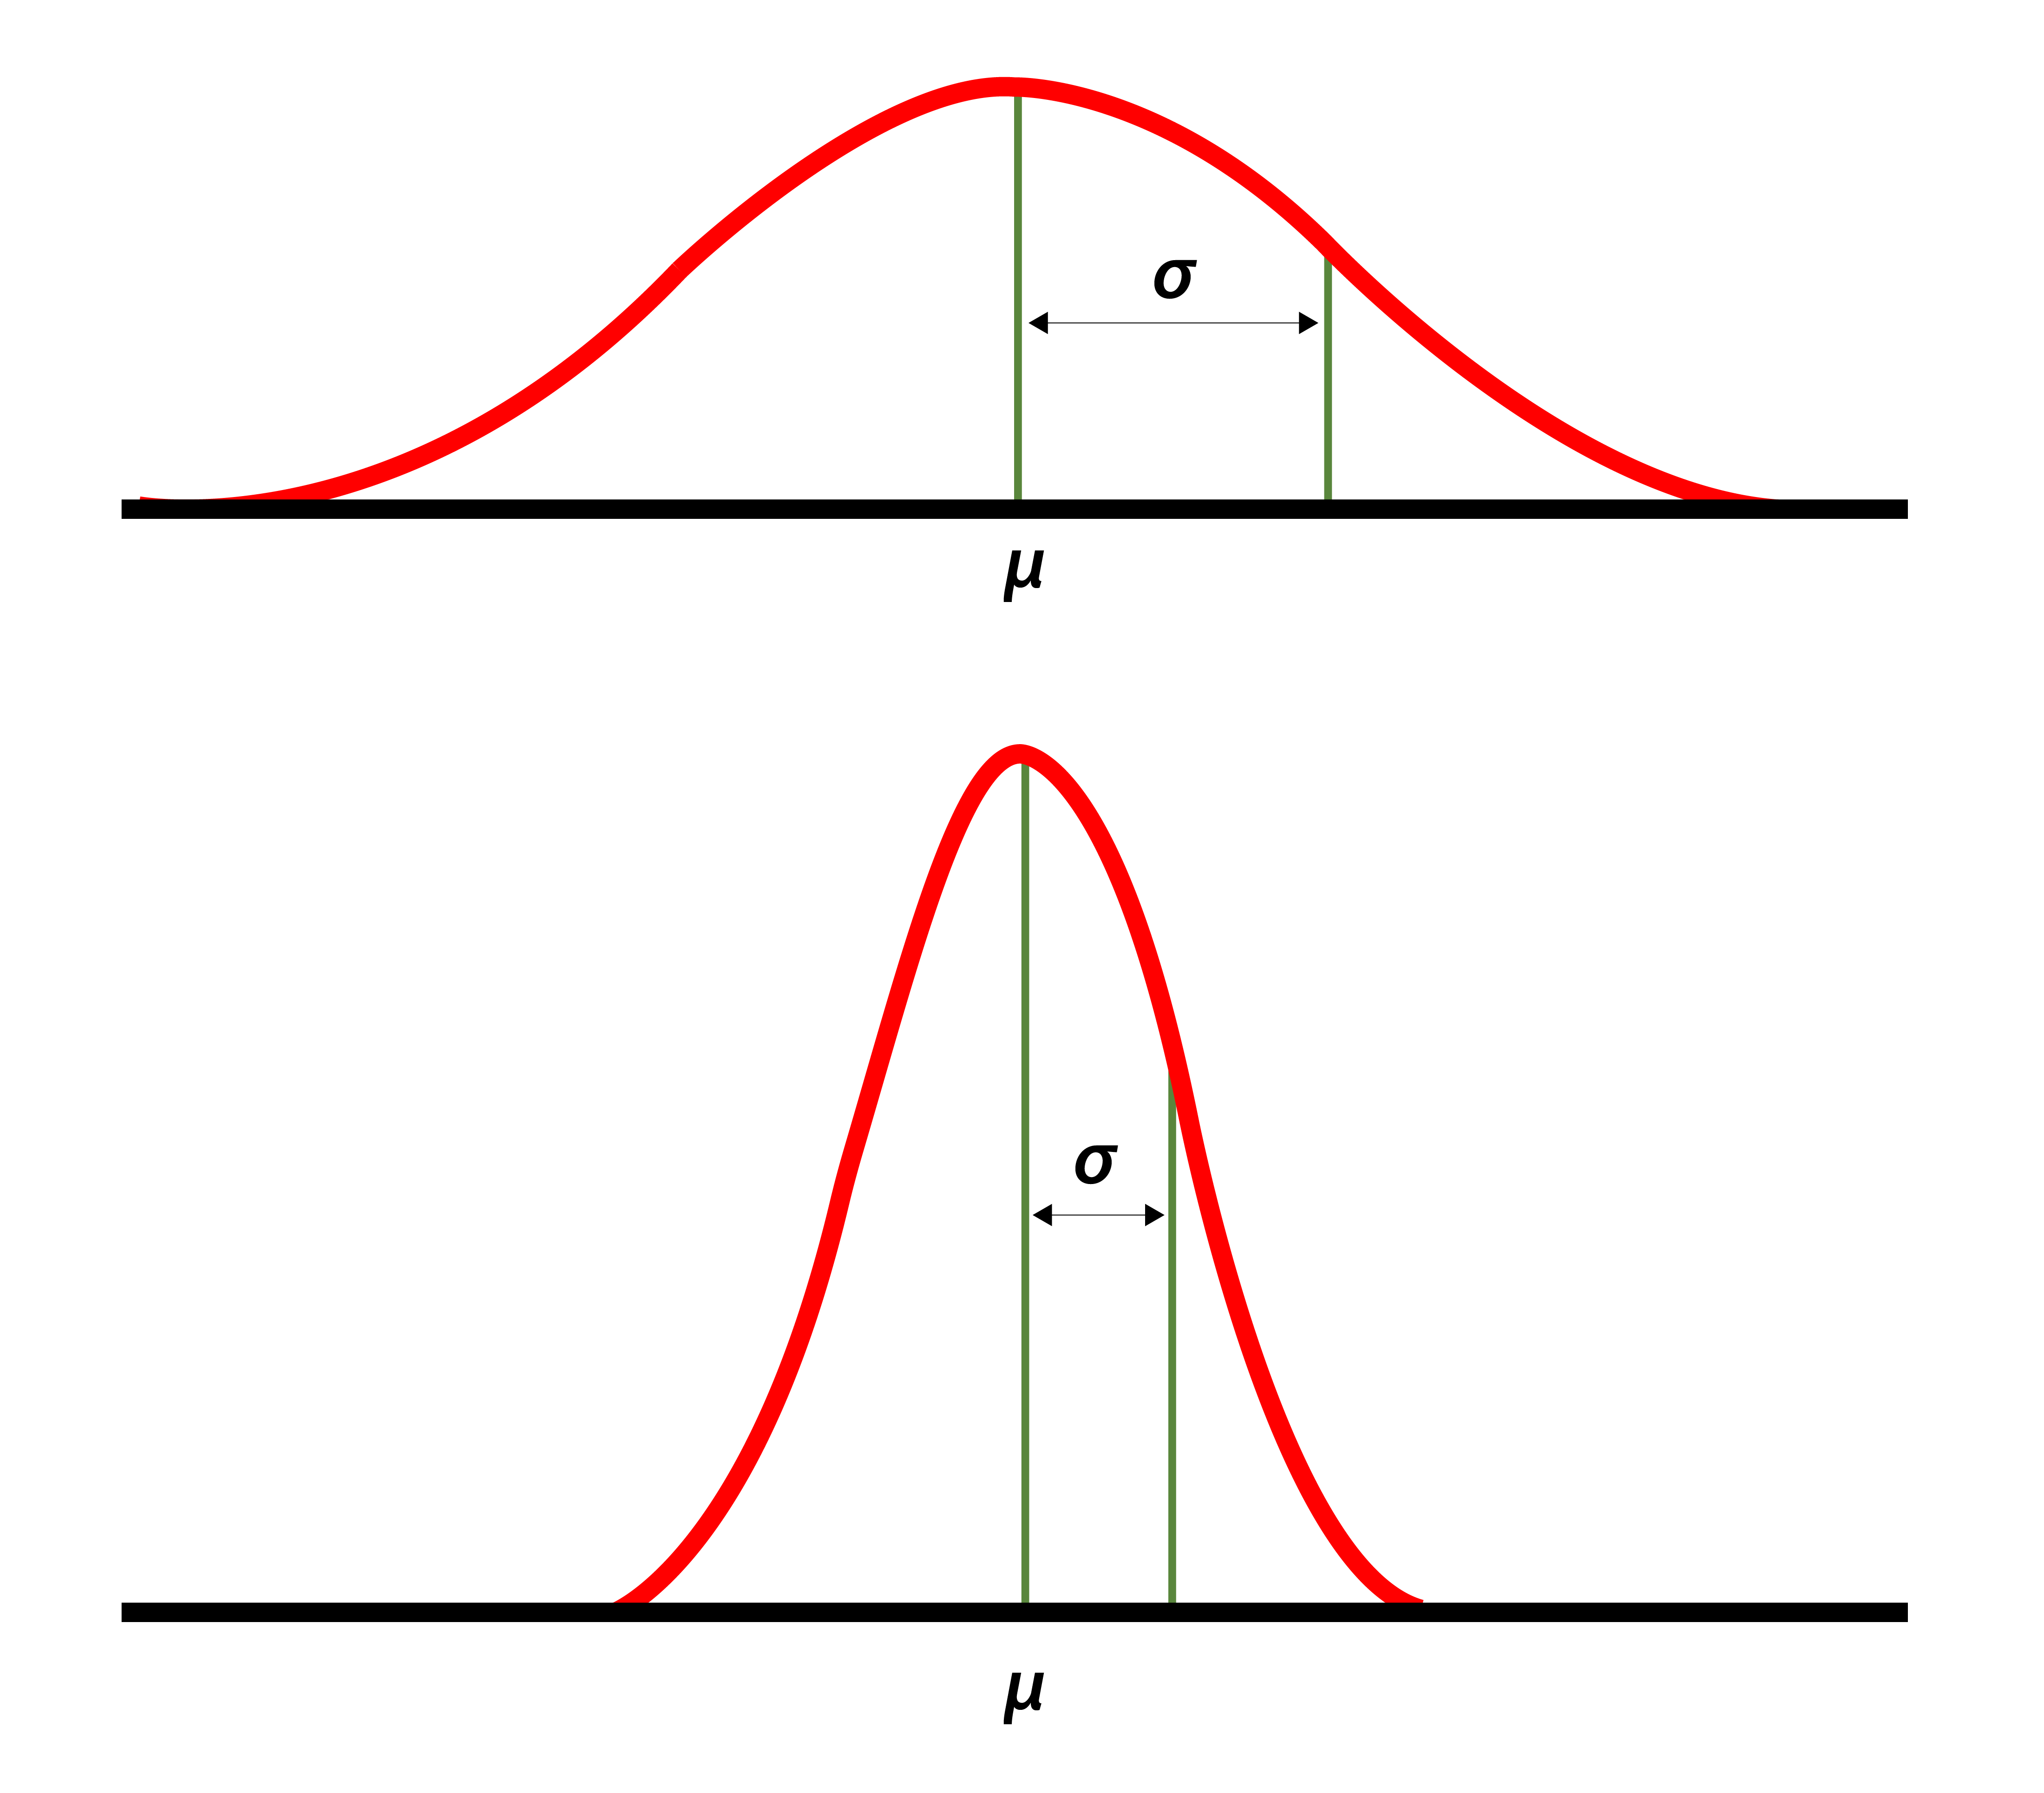
Once you’ve calculated the standard deviation, the next step is interpreting standard deviation. A small standard deviation indicates that the data points tend to be close to the mean, while a large standard deviation signifies that the data points are spread out over a wider range. Understanding this aspect is key to analysts and anyone looking to assess stability and performance against the mean.
Tips for Efficient Data Analysis in Excel
As you continue to work with Excel, incorporating effective techniques into your excel data analysis toolkit can enhance proficiency. Here are some excel tips that can aid in standard deviation calculations and broader statistical analysis.
Maximize Use of Excel Functions
Learning to use Excel functions for analysis properly can drastically reduce errors in calculations. Don’t restrict yourself to just standard deviation functions; explore correlation and regression functions for a rounder analysis. Using these features effectively helps you visualize your data better and gain insights more swiftly.
Data Cleaning and Preparation
Always start with cleaning your data. Tools within Excel help identify duplicates or erroneous entries. A clean dataset ensures that calculations, including your standard deviations, are reflective of true data trends. This approach truly enhances data handling in Excel for upcoming analyses as well.
Leveraging Excel for Business Analysis
In a business context, utilize Excel for research and data presentation to communicate your findings effectively. Craft structured reports that highlight your standard deviation example, statistical significance, and the impact on business strategies. This not only substantiates data-driven decisions but also communicates analytical results clearly to stakeholders.
Key Takeaways
- Understand and differentiate between standard deviation and variance for accurate analysis.
- Utilize Excel’s STDEV functions accurately, depending on your data set type.
- Prepare and clean your data to ensure precision in statistical calculations.
- Effectively interpret standard deviation and its implications for decision-making.
- Incorporate broader statistical tools in Excel to enhance overall analysis efficiency.
FAQ
1. What is the difference between STDEV.S and STDEV.P in Excel?
STDEV.S calculates the standard deviation based on a sample of data, reflecting the variability in a smaller portion of the population. On the other hand, STDEV.P computes standard deviation based on the entire population, giving a comprehensive dispersion measure. It’s crucial to choose the right function depending on your dataset.
2. How do I interpret the results of standard deviation?
Interpreting standard deviation revolves around its value relative to the mean. A low standard deviation indicates that data points are clustering close to the mean, while a high standard deviation reveals wider variability. This understanding helps in analyzing trends and making informed decisions based on data.
3. Can I visualize standard deviation in Excel?
Yes, you can visualize standard deviation using Excel charts such as line graphs or bar charts that incorporate error bars showcasing variability. This method aids in quickly communicating the range and reliability of your data insights to an audience.
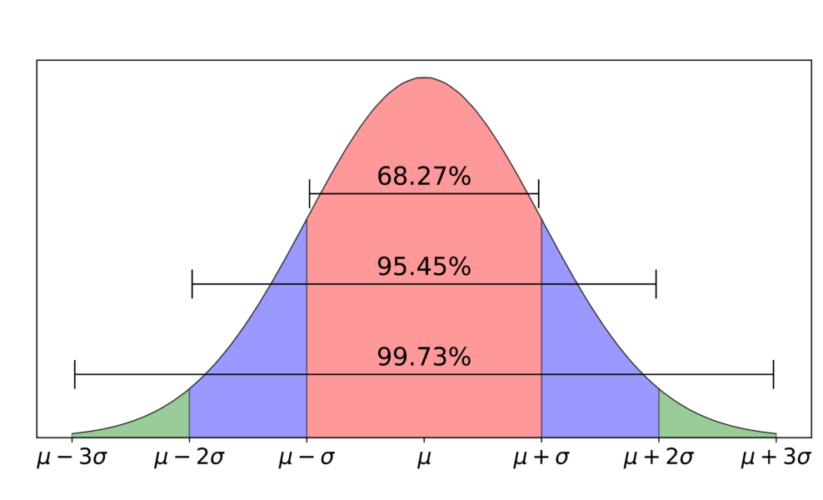
4. What kind of data is best suited for standard deviation calculations?
Standard deviation is best calculated with interval or ratio data that exhibits normal distribution. It’s vital to use appropriate data types as it provides meaningful insights, allowing analysts to comprehend how data trends might behave.
5. What are some common mistakes when calculating standard deviation in Excel?
Common mistakes include using the wrong function (STDEV.S vs STDEV.P), failing to clean data adequately, or overlooking outliers that can skew results. Ensuring accurate data entry and conditions directly affects the validity of standard deviation calculations.
For updated tutorials and more Excel tips, visit this link or explore various Excel tutorials here.